Go vs Rust vs C++: Why Our Service Benchmark Surprised Me
The surprising part was not that one language won. It was that the winner changed when we changed how the same pieces were connected.
I expected C++ and Rust to have an advantage in this test. The services do very little business work, and both languages give us plenty of control over what happens on the request path. Instead, our generated Go service handled about 57,300 orders a second. Rust handled 53,000. Our coroutine-based C++ runtime handled 48,200.
Then I looked at the simpler native implementations. Rust reached almost 87,000 orders a second and moved comfortably into first place.
Same machine, same scenario, same resource limits. A different answer to the question of which implementation was fastest. We spent a substantial amount of time finding out where that difference came from. Some of the work was productive. Some convincing ideas did not survive measurement.
What the request actually does
This is the canonical order-processing example in Service Architect. The example sources, runtime libraries, and benchmark runner are linked below. An HTTP request arrives at Order Service. The service processes the order's items, calls Inventory Service over gRPC, handles the result, and returns an HTTP response. The measured scenario deliberately takes the out-of-stock path. A business rejection is an expected result here, not a failed HTTP request.
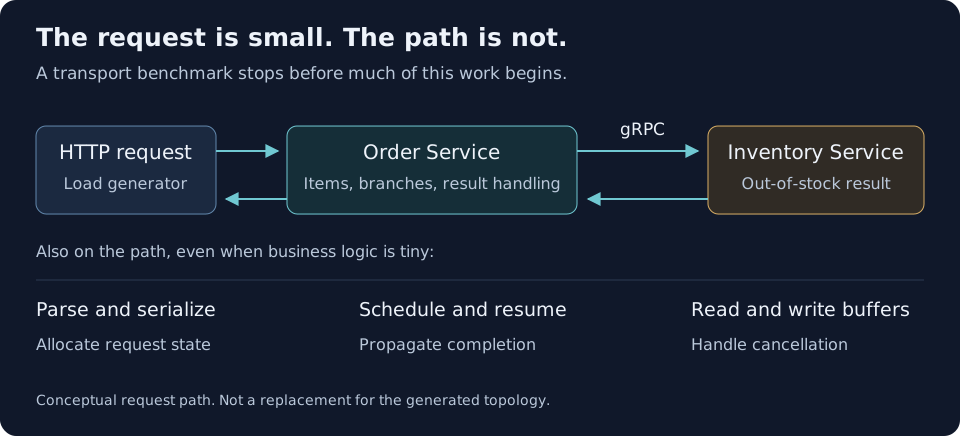
All generated versions preserve the same processing flow: how requests branch, how results are combined, and what happens when a time limit is reached. Before measuring performance, we check that the running services actually follow that flow. Otherwise, a faster result might simply mean an implementation is doing less work.
This is more representative of service integration than an isolated JSON or HTTP benchmark. It is still a small synthetic workload, not a production capacity forecast. There is no substantial database or domain workload to hide infrastructure cost. That is useful when infrastructure is what we want to examine.
The conditions, without the fine print hidden
- Request:
POST /v1/processorder, normal payload, expected HTTP200. - Resources: CPU quota of 2 cores per service container; 6 cores for the load generator.
- Load: 256 virtual users, 5 seconds of warm-up, three 20-second measurement runs.
- Monitoring: logging, metrics collection, and request tracing were disabled for every implementation. We checked this before each comparison to avoid giving one version extra monitoring work.
- Errors: 0.0000% reported for every variant.
A CPU quota is an allowance, not a promise that a runtime will use two cores, and not a restriction to two operating-system threads. The runs use Docker on the same development machine. Worker layout, event loops, and the virtual machine are part of these results.
The tables below reproduce the supplied three-run summary. Throughput means completed HTTP orders per second, not individual gRPC calls. The charts round throughput to whole orders; the tables and downloadable CSV retain the reported precision. We do not have confidence intervals in this summary, so small differences should not become architectural conclusions.
Go, Rust and C++ performance in the framework benchmark
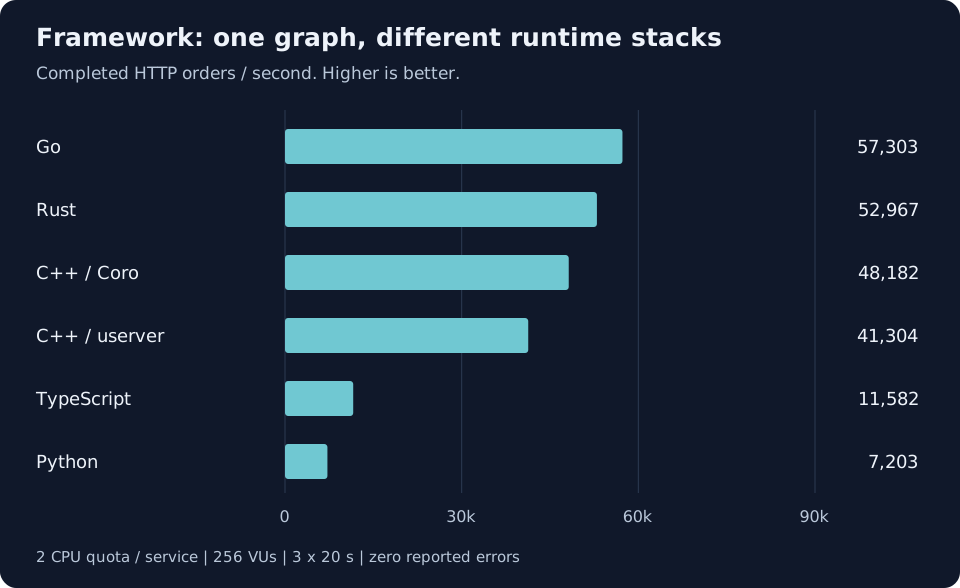
| Stack | Orders/s | Average | p50 | p95 | p99 | Max |
|---|---|---|---|---|---|---|
| Go | 57,302.55 | 4.391 | 4.299 | 7.252 | 9.833 | 28.217 |
| Rust | 52,966.80 | 4.747 | 4.688 | 5.853 | 9.320 | 44.460 |
| C++ / Coro | 48,182.05 | 5.247 | 5.182 | 6.552 | 8.396 | 31.053 |
| C++ / userver | 41,304.05 | 6.115 | 4.053 | 34.341 | 40.108 | 47.355 |
| TypeScript | 11,581.60 | 22.074 | 21.591 | 28.339 | 34.751 | 650.980 |
| Python | 7,203.15 | 35.487 | 29.785 | 61.041 | 69.289 | 97.278 |
cpp in the raw report is the userver-backed implementation. cpp-coro is our C++ coroutine runtime. They are two different stacks, not two names for the same C++ executable. This summary does not identify the Coro I/O backend, so I am not presenting it as an epoll-versus-io_uring comparison.
Go vs Rust: the result depends on which implementation we compare
Go (Golang) leads framework throughput here, about 8% ahead of Rust. In the native comparison below, Rust leads instead. That reversal is why I would not use either number as a standalone answer to whether Go or Rust is faster for microservices.
C++ userver vs Coro: throughput and tail latency tell different stories
The C++ results are at least as interesting: Coro handles about 17% more orders than the userver-backed version, while its p99 is 8.4 ms rather than 40.1 ms.
The median tells a different story. The userver-backed service has a p50 of 4.1 ms, lower than Coro's 5.2 ms. A typical request can look good while a smaller fraction waits much longer. If I only looked at the average, or only at requests per second, I would miss that distinction.
That does not diagnose userver. The similar tail in its native baseline, below, is a reason to examine the shared stack and execution environment before blaming graph traversal. A latency table cannot tell us whether a wait came from CPU throttling, scheduling, transport behavior, or contention.
Python vs TypeScript: compare backend implementations, not syntax
The generated TypeScript service handles about 11,600 orders/s and Python about 7,200. Their simplified native versions reach 15,400 and 13,900 respectively. Those are useful numbers for this backend workload, but they also show how much the implementation matters. TypeScript's type annotations are not a runtime scheduler, and giving a container two cores does not tell us how many processes or event loops are doing the work. I would check that execution model before drawing a conclusion about language limits.
What turned out to matter
My first instinct was to look for expensive business functions. There was not much business code to blame. The work was in the infrastructure between those functions.
HTTP and gRPC can each be fast, and still fit together badly
Accepting an HTTP request is not the same workload as accepting it, calling gRPC, and resuming the original handler. If the transports use separate worker pools, the request may need extra queue operations and wake-ups to move between them. A queue handoff is not necessarily an operating-system context switch, but neither is it free.
We investigated that boundary rather than assuming two individually fast libraries would automatically make a fast service. Moving to a shared execution model removed a source of handoffs. It did not make every other cost disappear, and the results here do not assign a percentage of the remaining gap to scheduling.
The same bytes can require very different amounts of work
One implementation may deliver a larger batch to the transport; another may repeatedly move small fragments through callbacks and system calls. Both eventually send the same response. They do not necessarily spend the same CPU time getting it there.
Small-write coalescing was one change we kept after repeated comparisons. It combined fragments already available for writing. It did not add a timer to wait for more data. Other buffer and descriptor experiments produced mixed results and stayed out of the main implementation.
That distinction matters. A plausible explanation is a starting point for an experiment, not a reason to ship it.
Removing allocations was not the whole Rust story
We spent time removing unnecessary boxing and dynamic dispatch from the Rust graph. That was worthwhile work, but it also exposed another cost: the state held by a composed future can become large. In our investigation, some moves involved kilobytes of future state rather than a small pointer.
Putting a future behind a box introduces an allocation, but can keep the surrounding state smaller. Removing the box avoids that allocation, but does not guarantee less total work. We stopped treating an allocation count of zero as the objective. The objective was a faster request path with the same behavior.
This is also why a microbenchmark can give an honest answer that turns out not to help much. It measures the piece you isolated. It may leave out exactly the buffering, ownership, and scheduling boundaries that dominate once the pieces are connected.
Native: a useful reference, not an identical workload
The native versions implement an almost equivalent order-processing scenario with a number of simplifications. They follow the same external HTTP-to-gRPC business path, but do not reproduce every part of the general graph runtime. Direct code can specialize the route instead of preserving all the graph's composition machinery.
So the difference is not a clean measurement of framework overhead alone. It includes the consequences of simplifying the implementation. I keep these results separate because they answer a different question: how does the stack behave when much of that general machinery is absent?
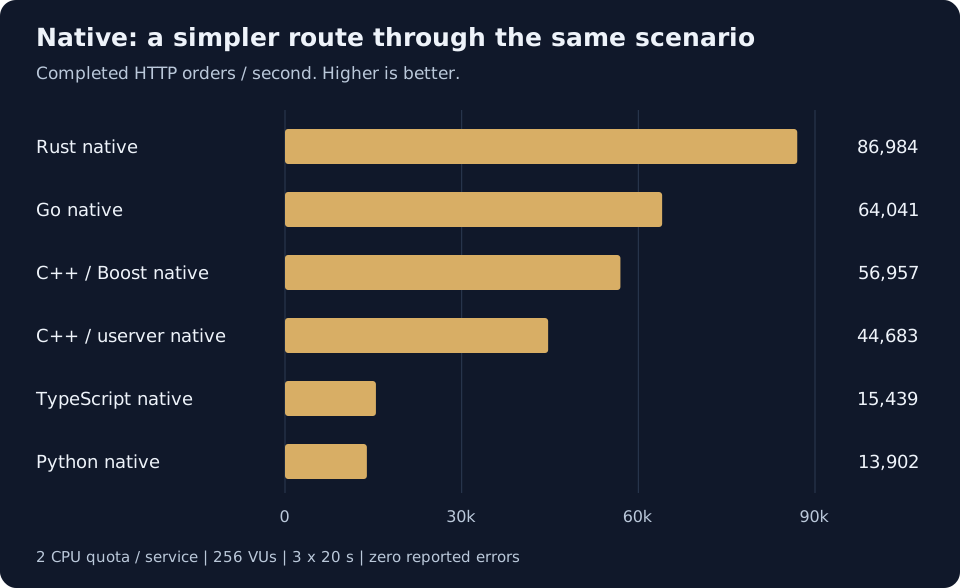
| Stack | Orders/s | Average | p50 | p95 | p99 | Max |
|---|---|---|---|---|---|---|
| Rust native | 86,984.20 | 2.859 | 2.708 | 4.384 | 8.187 | 39.840 |
| Go native | 64,041.45 | 3.921 | 3.786 | 6.458 | 9.444 | 33.745 |
| C++ / Boost native | 56,956.90 | 4.398 | 4.010 | 8.491 | 13.531 | 25.336 |
| C++ / userver native | 44,683.20 | 5.634 | 3.566 | 34.625 | 41.526 | 72.543 |
| TypeScript native | 15,438.80 | 16.543 | 16.605 | 19.902 | 22.481 | 542.384 |
| Python native | 13,902.45 | 18.373 | 16.405 | 26.426 | 32.281 | 43.286 |
The cpp-boost-native label belongs to the direct Boost-based baseline. It is not another generated framework version, nor a claim that it uses exactly the same transport integration as Coro.
Rust reaches nearly 87,000 orders/s here, compared with 53,000 through the graph. Go moves from 57,300 to 64,000. The userver pair is closer: 41,300 versus 44,700. Even after simplification, the stacks remain quite different.
I would not call the native result a hard ceiling, either. It is another implementation with its own choices. What it gives us is a reason to investigate: Rust clearly can run this broad scenario much faster than our current generated path. That does not tell us which layer to change next.
Source code and benchmark runner
The examples and runtime libraries are public. Each example repository contains the service implementation, so the HTTP handlers, gRPC calls, and business functions can be inspected rather than inferred from a throughput chart.
| Stack | Example source | Runtime source |
|---|---|---|
| Go | goexample | servicelib |
| Rust | rustexample | rustservicelib |
| C++ / userver | cppexample | cppservicelib |
| C++ / Coro | cppcoroexample | cppcoroservicelib |
| Python | pyexample | pyservicelib |
| TypeScript | tsexample | tsservicelib |
The simplified native implementations are separate repositories:
- Go: gonativeexample.
- Rust: rustnativeexample.
- C++ / userver: cppnativeexample.
- C++ / Boost: cppboostnativeexample.
- Python: pynativeexample.
- TypeScript: tsnativeexample.
The Boost native repository is the direct C++ baseline listed in the results, not a generated Coro example. The source lets readers inspect the simplifications; the external scenario alone does not establish identical internal work.
The benchmark repository contains the measurement tooling. Start with its example benchmark instructions and runner implementation for workload preparation, resource settings, repetitions, and result selection. Follow those instructions rather than treating the numbers here as a standalone recipe.
These links point to maintained repositories, not frozen revisions of this particular run. The CSV preserves the supplied result summary; it is not the raw per-run log. Those logs and a complete revision manifest are not published with this article. The code makes the design inspectable, but exact reproduction of this snapshot still requires those artifacts. I do not want to imply otherwise.
What I would take into a real stack decision
I would start with a thin slice of the actual service: the ingress protocol, an internal call, the expected payload, and the failure path. Not just an empty HTTP handler. If the real system streams responses or spends most of its time querying a database, I would include that before making a language decision.
I would also use the intended CPU budget. A worker arrangement that looks harmless with spare cores can behave differently inside a small container. And I would measure tails as well as throughput: a service with a lower median is not automatically a better fit for a strict response-time budget.
Finally, I would keep the result narrowly stated. This run says Go is the fastest of these generated implementations in this scenario. It does not say Go beats Rust at computation, that C++ is slow, or that Python is a poor choice for a service dominated by external I/O. A larger CPU quota also does not make a single event loop use additional cores by itself.
Three short runs are enough to expose large differences worth investigating. They do not replace sustained-load tests, overload behavior, realistic payload distributions, or measurements with observability enabled. For a reproducible comparison across machines, we would also need exact source revisions, compiler and library versions, build flags, worker settings, and host details. This summary is a snapshot of our implementations, not a universal league table.
We did make the services faster. The more useful outcome was learning how often the cost lived somewhere other than the code I initially suspected. Language choice matters. So does the way the HTTP server, RPC client, scheduler, and application runtime cooperate on a single request.
I still expect C++ and Rust to do well. I just want to see the whole request complete before deciding how well.
These are new measurements under the conditions above. The earlier framework-cost article used a different protocol and older implementations; its numbers should not be treated as a controlled before-and-after comparison.